Illam Park
Dept. of Chemistry & Biochemistry, UCLA, USA
illam@chem.ucla.edu
Abstract
Adsorption cellular automata (ACA), a novel method of nonequilibrium
molecular simulation, was used to investigate the phase behavior of complex
fluids in nanopores. Equilibrium and dynamic behavior of ACA was demonstrated
for nitrogen adsorption of the 2-d model nanoporous media, which are composed
of parallel plates or a regular packing of rods. Pore-widths between 2
and 10 molecular diameters and surface energies between 2 and 20 in kT
were considered. The results showed various isotherms and hysteresis loops
depending on model adsorbent, surface energy, pore width and nonisothermality.
Microstructural evolution of the interfacial growth revealed physical mechanisms
underlying various isotherms and hysteresis loops.
INTRODUCTION
Complex phase behavior of the pore fluids in well-defined nanopores
has been of a great concern in synthesis of metallic nanofibers within
carbon nanotubes, in characterization of mesoporous carbon molecular sieves
by high-resolution adsorption and in microbial-growth in porous membranes.
The major issue is how precisely the macroscopic properties such as isotherms
and hysteresis loops can be related to the structural properties of nanopores.
Recent investigations have suggested that the equilibrium-based theories
such as the Kelvin equation may not adequately describe the phase transition
behavior even in a simple and well-defined nanopore. For instance, nitrogen
adsorption of mesoporous crystalline media such as MCM41 has shown a negligible
hysteresis loop [1, 2] or an unexpected type of hysteresis [3], instead
of a distinctive, IUPAC type H1 loop associated with capillary condensation
(p. 127, [4]). Understanding of such an unusual problem is imperative for
precise design and characterization of nanoporous materials and for development
of an accurate adsorption theory. In this paper, I introduce a novel method
of nonequilibrium simulation called Adsorption Cellular Automata, and demonstrate
its versatility for investigation of the surface-induced phase transition
in nanoscale. Both dynamics and equilibria are explored for nitrogen adsorption
of the model nanoporous adsorbents (packed rods and the parallel plates).
IUPAC type III, IV and V isotherms and H1 and H2 hysteresis loops are reproduced.
The simulation results reveal how the monolayer, multilayer, or capillary
condensation, predicted from the adsorption isotherm, could be different
from the actual microstructural growth in nanopores.
ADSORPTION CELLULAR AUTOMATA
Figure 1. A cellular automata simulated annealing process: a lattice of 200´ 200 cells occupies the external square of the circular boundary. Each cell, empty or occupied at a probability of 0.5 at CA time=1, undergoes transition to the majority party of its neighbor cells.
Adsorption Cellular Automata (henceforth, ACA) simulation [5] uses a simple phase transition algorithm adapted from cellular automata (CA) simulation [6]. Fig. 1 shows a CA simulated annealing process that is applicable to the coarsening of phases in a binary fluid (A+B) system such as a water-oil, gas-solid or vapor-liquid mixture. A lattice of cells used in lattice-gas Monte Carlo (MC) simulation approximates the computational geometry of CA. Unlike the MC method, however, the states of the CA cells are deterministic by the initial configuration because the number density of a local area judges the cellular transition at each time step. For a local area of 3 by 3 cells, the center cell becomes A if the majority party (more than five) of the local cells is A. Else, it becomes B. This simple rule leads to the natural coarsening behavior and a much faster evolution compared to the MC based simulation. Notice the apparent structural change within CA time=17 in Fig. 1. An equivalent change may be achievable after thousands of time steps in the lattice-gas MC system. The efficient CA algorithm for the natural process strongly suggests a possible existence of a simple rule on the surface-induced phase transition.
In ACA, a similar majority rule is applied to the interfacial cells, based on discrete potential energy rather than number density. The interfacial cells evolve synchronously depending on their cell energy relative to the potential energy of the random field (bulk gas). The fundamental concepts employed in ACA are the following [5]: (i) the thermodynamics for phase-transition at the interface between the bulk gas and the adsorbed phase, (ii) limited pore-accessibility due to pore-blocking or volume-exclusion by admolecules, and (iii) thermal relaxation upon releasing and absorbing the latent heat of phase transition. Each cell has one of the cell values 0, ef0, and es0 which represent the void space, admolecules and solid molecules, respectively. The state of the i-th cell is defined by the sum of cell values of its neighbors,
ACA equilibrates in the following way to achieve Eq. (2). First, a flood fill through the composite media of solid molecules and admolecules identifies the accessible interfacial area (IG). The rate of condensation on the interfacial area is assumed to be the first order reaction suggested by the Langmuir kinetics, fa=kap. Of the total NIG cells, only the predetermined fraction (fa) is randomly occupied.
Second, the states of the interfacial cells (IAÈ IG) are evaluated using Eq. (1). If ei is higher than f +ef, the cell will be occupied by an admolecule. Else, it will be unoccupied. Then, the net energy involved in the phase transition is determined by
The algorithm for ACA can be summarized as follows. For each evolution time:
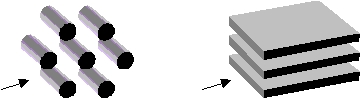
Figure 2. Model adsorbents: (left) hexagonal packing of rods;
(right) parallel plates; the arrow points the direction of molecular diffusion
considered in the present work.
Fig. 2 shows the model quasi-crystalline media used as the adsorbents: (i) a hexagonal packing of rods and (ii) layered parallel plates. The present simulation is performed on the two-dimensional lattice ignoring the effects of the adsorbent length perpendicular to the arrow direction. This approximation will be valid if the adsorbents are extensively long. Two-dimensional analogies of the model (i) include fibrous media such as carbon or silica nanofibers and powder compacts. The model (ii), on the other hand, can be applicable to nanotubes such as MCM41 and micro-slits such as activated carbons. The stride between rods or plates controls the pore size while the growth limit around a primary crystalline particle controls the mesopore [5].
Table I shows the system parameters used for simulation. The physical properties of the gas phase refer to the properties of nitrogen. Effects of the pore-width, and the surface free energy, temperature, and thermal interaction factors (a and b) are considered for simulations.
| Parameter | Value |
| Isotherm temperature, T0/K | 77.4-87 |
| Saturation vapor pressure, p0/bar | 103.638-257.9/(T0-6.344) |
| Surface free energy, Es0/RT0 | 2-20 |
| Ratio of pore width to molecular diameter | 2-10 |
| Lattice dimension/cells | up to 250x250 |
| Thermal sensitivity, a | 100 |
| Nonisothermality, b | 0-1 |
RESULTS AND DISCUSSION
Figure 3. A typical time-dependent equilibration curve upon addition of a gas dose into the system.
Fig. 3 shows a typical equilibration behavior of the ACA with the model adsorbent (i). The extent of uptake (dashed line) increases gradually as time elapses and then reaches the asymptote toward a new equilibrium state. The temperature (solid line) rises abruptly and then decreases back to the isotherm temperature. This behavior agrees with the behavior of real systems observed in dynamic experiment [7]. The system, apparently, reaches the new equilibrium within 500 ACA steps. In general, the time required for equilibrium varies with the kinetic parameters including nonisothermality, gas dosage, and constriction of the pores.
Figure 4. Type IV isotherms and type H2 hysteresis loops of the hexagonal packing model. 250 by 250 cells, D/Dm=2, Dp/Dm=6, Es0=9, b=0, 0.6, and 0.8. . The numbers on the curves indicate the sequence of equilibrium points, and are referred to as P in the text.
Figure 5. Microstructural evolution of the adsorbed-phase domain.
The configurations were taken at the quasi-equilibrium points of the highly
nonisothermal case in Fig. 4. The solid phase (the packing of rods) is
in black, the adsorbed phase in red, the accessible space in green, and
the trapped region (inaccessible space) in blue. The numbers on images
indicate the sequence of equilibrium points, and are referred to as C
in the text.
Fig. 4 shows the isotherm plot of quasi-equilibrium points from the time-dependent curves after 500 time steps. Each curve is the locus of steady states for a cycle of ascending and descending pressure changes. The small variation among the isotherms indicates the effect of nonisothermality (b) on the quasi-equilibrium behavior. The presence of double sharp increases in each isotherm curve is characteristic of the type IV isotherm while the pronounced plateau followed by the abrupt fall is of the type H2 hysteresis. Similar behavior is often observed in adsorption of powder compacts [4]. The sharp increase in the lower-pressure region (P1 to P2) is responsible for condensation of the internal pore space of the primary adsorbent particle (the packing of rods) while the other one in the higher-pressure region (P9 to P12) is for condensation of the external space up to the growth limit. The occurrence of hysteresis is due to blocking of the access between the bulk gas and the interfacial area near the complete filling of the external space. Adsorption or desorption in this case becomes time demanding and never truly equilibrates within the given equilibration time. The time requirement increases as the nonisothermality is introduced more. Accordingly, the hysteresis loop enlarges and the maximum filling capacity decreases. This confirms the dependence of hysteresis on adsorption kinetics, which has been discussed extensively using a rigorous macroscopic approach to the dynamical nature of adsorption [8].
Fig. 5 shows the microstructural evolution of the adsorbed domain for the highly nonisothermal case in Fig. 4. The numbers on configurations correspond to the isotherm points in sequence. For simplicity, C and P followed by numbers indicate particular configurations and isotherm points, respectively. For instance, P1 and C1 denote point 1 and configuration 1, respectively. First, consider C1 and C2 corresponding to the monolayer process indicated by P1 and P2 in Fig. 4. As in C1, admolecules in red are spread over the interior of the adsorbent particle rather than forming a monolayer film. The apparent monolayer transition in the isotherm is due to adsorption of energetically uniform sites rather than physically uniform surface. The sites responsible for the monolayer transition are distributed in the pore necks having a width of one or two molecular diameters. Thus, the monolayer process accompanies blocking of micro-cavities as shown in C1 through C3 (the blue area). In contrast, adsorption onto the exterior of the particle leads to the multilayer growth shown in C6 to C12 (the steep region of the isotherm between P6 and P12). The growth is decelerated near the growth limit (C12 to C16). The interfacial coastline evolves from a rough to a smooth line, implying a reduced interfacial area. Eventually, no effective interfacial area will be available so that further addition of doses merely increases the pressure rather than the uptake. If the pressure is decreased, the major interfacial area will be recovered but the recovering process takes longer due to the limited access between two interacting phases. The plateau followed by the steep fall of the isotherm (P16 to P20 to P60) represents the effect of limited accessibility. C20 shows the onset of the reopening and triggering the major desorption. Automatic desorption of the supersaturated phase lasts until the state reaches the true equilibrium (C39 versus C9 and C60 versus C4).
Figure 6. Layering, pore-filling and condensation (parallel plates). (isothermal open system, ES0/RT0 = 18, Ef0/RT0 = 3, D/Dm= 6, Time = 300). The numbers on the curve are the sequence of isotherm points, which equal to the sequence of the configurations in Fig. 7. They will be referred to as P in the text. The dashed line indicates the region of instability.
Figure 7. Microstructural evolution of condensed vapor in parallel
plates. The configurations were taken at the isotherm points
in Fig. 6. Blue and white denote the accessible space and the inaccessible
space, respectively. Black denotes the adsorbed or solid phase. The numbers
on images indicate the sequence of equilibrium points, and are referred
to as C in the text.
Figs. 6 and 7 show the phase transition behavior in the parallel plates in the full range of vapor pressures. The system used here is an isothermal open system. Therefore, the pressure is constant during the equilibration process. The interface varies between the solid surface (ES0/RT0=18) and the liquid surface (Ef0/RT0=3). The isotherm of type IV without hysteresis in Fig. 6 resembles nitrogen adsorption isotherms of MCM41 (nanotubes) [1,2] apart from the region of instability. Similar transition can be found in the adsorption of cyclopentane vapor onto MCM41 [3]. Interestingly, the unusual hysteresis loop of [3] is located in the region of instability. The steep increase near p/psat=0 in Fig. 6 (P1 to P2) is attributed to the monolayer growth. Notice in Fig. 7 the monolayer film (C2) on the solid surface (C1). The slow transition from P4 to P10 is due to growth of vapor clusters onto the first layer as well as in the pore space.
The second steep region of the isotherm (P11 to P 14) is not attributed
to the conventional capillary condensation in the pore of D/Dm=
6. Instead, C11 through C14 reveals that the steep increase is due to the
rapidly growing population of clusters in the exterior of the particle
rather than growth of the second or higher layers. The clusters are mobile
adsorption sites and thus affect the uptake. As the pressure is further
increased, the second and third layers appear on the surface, and larger
clusters appear in the exterior of the particle. In this way, the uptake
increases up to P17. However, interestingly, the uptake decreases in the
range between P19 and P23. This implies that there is an optimal cluster
size for the maximum uptake. Larger clusters at a higher pressure provide
a less mobile interfacial area due to lower gas accessibility. Notice in
Fig. 7 the inaccessible areas in white surrounded by clusters in C21 and
C22. This explains the instability (dashed line) in Fig.6. At the saturation
pressure, all these mobile interfaces eventually collapse onto the surface
leading to capillary condensation (C24).
Figure 8. Type H1 hysteresis (parallel plates). AD and DE denote adsorption isotherm and desorption isotherm, respectively. All the conditions are the same as in Fig. 6 except for the equilibration time (t).
Fig. 8 shows type H1 hysteresis loops depending on equilibration time. The system and conditions are the same as in Fig. 6. The hysteresis loop in the steep middle region of the isotherm enlarges as the equilibration time decreases. This is because the equilibrium points in the steep region require a much longer equilibration time compared to others. If the equilibration time is insufficient for one particular region, the isotherm will be hysteretic [8]. In other words, hysteresis will disappear as the time increases sufficiently. Recall that there is no hysteresis when the time is 300 in Fig. 6. This result clearly answers the question regarding the appearance and disappearance of hysteresis in nitrogen adsorption [1].
CONCLUSION
The dynamic and equilibrium behavior of adsorption cellular automata has been demonstrated for nitrogen adsorption of the model nanoporous adsorbents (packed rods and the parallel plates). The simulation has reproduced the typical isotherm behavior as well as the hysteresis behavior observed in experiments. Possible discrepancies between the equilibrium-based theories and the real systems with regard to monolayer transition and capillary condensation have been suggested by showing the microstructural evolution of the interface. The origin of hysteresis for types H1 and H2 has also been elucidated.
REFERENCES